Written by Jem Barrett
Illustrated by Winsy Leung
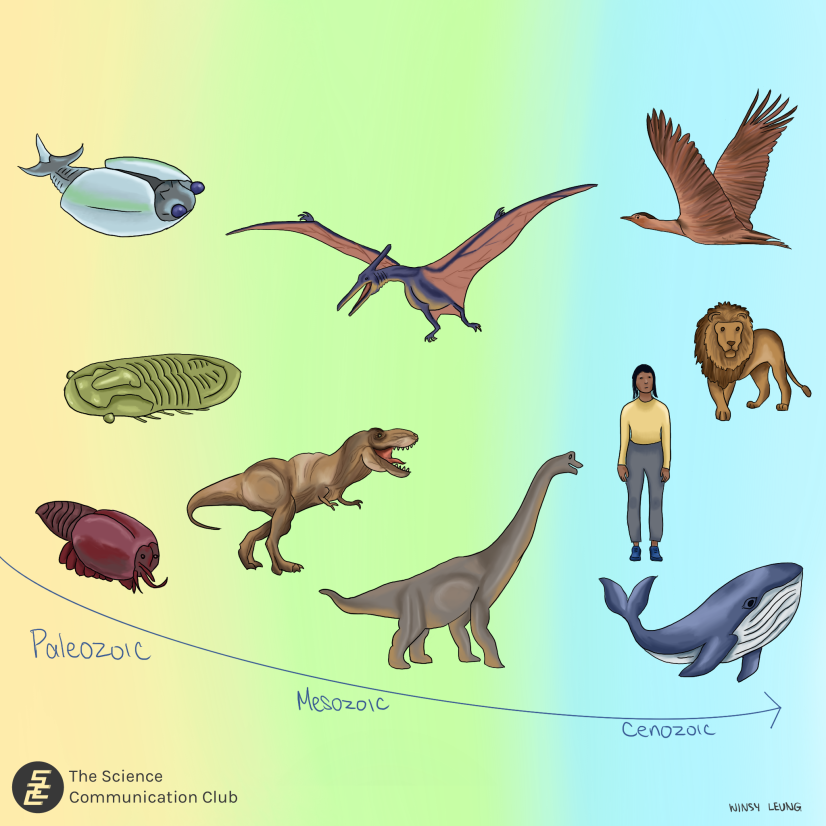
In the 3.7 billion years since life first appeared on Earth, countless species have appeared and nearly as many have disappeared. Renowned paleontologist David M. Raup wrote that practically all species that have ever lived are now extinct.¹ This is due to a combination of the background rate of extinction, during which species can gradually go extinct independently, and mass extinction events. Although there have been five mass extinction events since life first appeared, these were only labeled as such millions of years afterwards. How can we tell if we’re actively in the midst of the 6th mass extinction event?
Mass extinction events have historically been defined as a loss of over 75% of the species existing on Earth over the course of 2 million years or less.² Rates of extinction are often expressed through fraction of species going extinct over time, known as extinctions per million species-years (E/MSY).² Species-years are calculated based on when taxonomists first describe a species. For example, taxonomists described 5000 bird species by 1845, and sixty-one of those species went extinct by 2012.³ Dividing the number of extinct species (61 species) by the time frame (167 years) multiplied by the total number of species (5000 species) provides an extinction rate of 73 extinctions per million species-years.³ ⁴ Current research places the background rate of extinction at approximately 0.1 E/MSY.⁵ When the rate of extinctions becomes significantly higher than this background rate, scientists grow concerned that we may be facing a mass extinction event. Present-day extinction rates are estimated to be around 100 E/MSY, which is roughly a thousand times higher than the background rate of extinction.⁵ And yes, scientists are very concerned.
The International Union for Conservation of Nature (IUCN) publishes a Red List of Threatened Species, the most comprehensive record of plant and animal conservation status.⁶ The goal of the Red List is to assess the extinction risk of all species as either Least Concern, Near-Threatened, Vulnerable, Endangered, Critically Endangered or Extinct from the year 1500 to present day. From 1980 to 2008, an average of 52 species per year moved one Red List category closer to extinction.⁷ If the likelihood of moving from one Red List category to an adjacent one were identical, this would result in an extinction rate of 450 E/MSY, which is four thousand five hundred times higher than the background rate of extinction.⁵
As of 2023, the IUCN has evaluated all known bird species and 90% of mammal species.⁸ Despite assessing a total of 157,190 species, this is only 7% of the total ~2.15 million described plant and animal species.⁸ While their assessments may be spot on for mammal and bird species at risk, the IUCN Red List is heavily biased towards land-dwelling vertebrates, particularly birds and mammals.
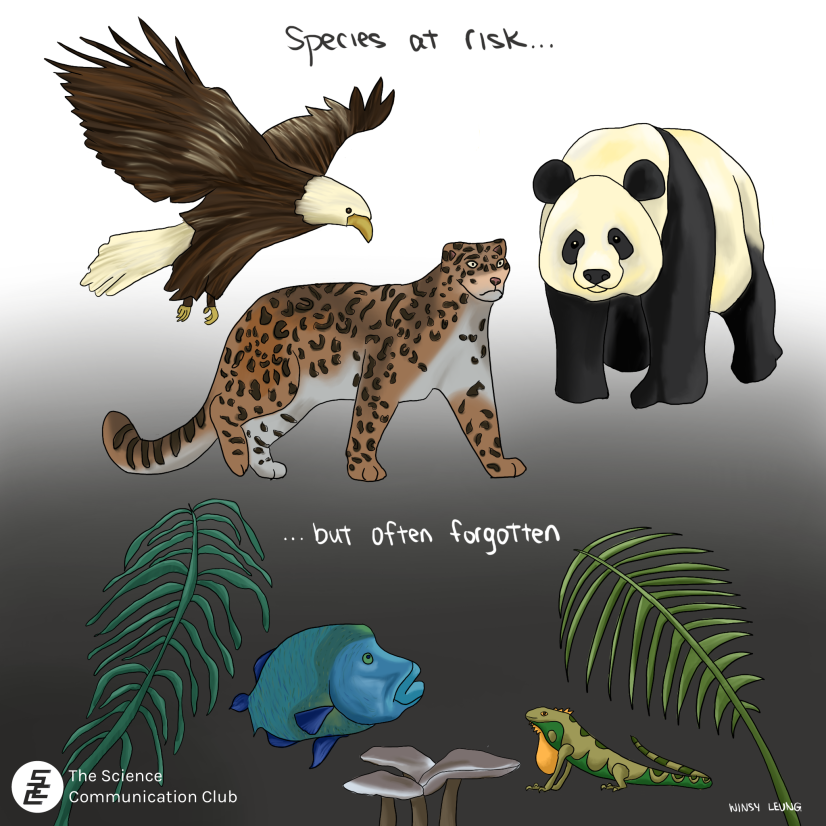
We must be careful to avoid assuming that bird and mammal extinction rates reflect extinction rates of all life on Earth. Birds and mammals are often rather charismatic species that receive attention in the media as well as considerable conservation support, without which their rate of extinction would likely be much greater.⁹ Furthermore, the IUCN Red List is heavily biased towards well-known species with sufficient data, leaving rare or largely unknown species with small populations and narrow habitat ranges at higher risk of extinction.¹⁰ As of 2023, the IUCN Red List has evaluated 83% of described vertebrate species, but only 2% of described invertebrate species. Plants have fared slightly better as 16% of described species have been evaluated, while fungi remain the most mysterious category with only 0.5% of described species having been evaluated for risk of extinction.⁸
Then there are the species that we’ve never even encountered. The term “dark extinction” refers to species that have gone extinct without being scientifically described, and sometimes without leaving any physical trace.¹¹ Dark extinctions in birds alone could increase the IUCN’s extinction estimates by 150%, demonstrating yet another underestimate of present-day species extinctions.¹¹ Recent studies have estimated that the number of plant and animal species on Earth is closer to ~8.7 million species, four times the number of species described by the IUCN.¹² The Red List thus provides an extremely limited perspective on overall extinction and biodiversity patterns.
So, now what? It’s evident that we need to gather more data and knowledge on these lesser-known species. Approximately 6200 new species have been described annually over the last 20 years.¹² The estimated cost to describe a new species is $48,500 USD. At this rate, it would take roughly 1,200 years and cost $364 billion USD to describe the remaining species on Earth.¹² With current extinction rates at 100 E/MSY, the harsh reality is that we are running out of time to gather the data that conservation scientists need to make informed decisions.
Once again, we return to the question of whether we are in the midst of the 6th mass extinction. But I want to know, does it really matter? We are experiencing biodiversity declines, global warming, and species extinctions on a scale unprecedented since long before our earliest ancestors appeared on the scene. Previous mass extinction events have been defined as a loss of at least 75% of species on Earth over the course of 2 million years. The current rate of extinction has skyrocketed past background rates and modern humans, or Homo sapiens, have only existed on Earth for roughly 200,000 years.¹³ Whether we call it a biodiversity crisis, the 6th mass extinction, or merely the human effect, it is evident that our approach to conserving global biodiversity needs to change if we hope to maintain the diversity of life on Earth.
The “Big Five” Mass Extinction Events
Event | When it Ended | Percentage of Species Lost | Proposed Cause |
The Ordovician Event | ~443 million years ago | ~86% of species lost over a period of ~1.4 million years | Changing climate on Earth with a brief glacial period that lasted less than 1 million years.¹⁴ This resulted in two pulses of extinction, with the first occurring at the beginning of the glaciation and the second happening as it ended.¹⁵ |
The Devonian Event | ~359 million years ago | ~75% of species lost over a period of between 2 and 29 million years | Shifts in nutrient availability in the oceans led to high primary productivity at the surface, causing elevated photosynthesis rates that depleted oxygen and resulted in ocean eutrophication, meaning that there was no oxygen available for the rest of the ocean.¹⁶ |
The Permian Event | ~251 million years ago | ~96% of species were lost within a period of between 160,000 to 2 million years | The most severe extinction event (possibly triggered by Siberian volcanic activity) was accompanied by a sixfold increase in atmospheric carbon dioxide (CO2) levels¹⁷, meaning that species were subjected to hypercapnia, the physiological effects of elevated CO2. The Earth underwent extreme global warming and ocean acidification.¹⁸ |
The Triassic Event | ~200 million years ago | ~80% of species were lost within a period of 600,000 to 8.3 million years | Evidence suggests that increased volcanic activity in the Central Atlantic Magmatic Province (CAMP) released massive amounts of gases (CO2, sulfur, and methane) leading to elevated global temperatures and ocean acidification.¹⁹ Uncertainties remain regarding whether one main trigger or a combination of environmental factors contributed to this extinction event.²⁰ |
The Cretaceous Event | ~65 million years ago | ~76% of species were lost within a period of time between less than a year to 2.5 million years | An 10km diameter asteroid hit Earth within the Yucatán state of the Gulf of Mexico leading to dramatic changes in environmental conditions. The impact released massive amounts of dust, ash, and sulfur into the atmosphere, blocking out the sun and plunging the planet into an extremely cold state known as “impact winter”.²¹ |
Sources:
- Raup DM. 1981. Extinction: bad genes or bad luck? Acta geológica hispánica: 25-33.
- Barnosky AD, Matzke N, Tomiya S, Wogan GOU, Swartz B, Quental TB, Marshall C, McGuire JL, Lindsey EL, Maguire KC, Mersey B, Ferrer EA. 2011. Has the Earth’s sixth mass extinction already arrived? Nature 471(7336): 51-57.
- De Vos JM, Joppa LN, Gittleman JL, Stephens PR, Pimm SL. 2014. Estimating the normal background rate of species extinction. Cons. Bio. 29(2):452-462.
- Pimm SL, Raven P, Peterson A, Ehrlich PR. 2006. Human impacts on the rates of recent, present, and future bird extinctions. PNAS 103(29):10941-10946. https://www.pnas.org/doi/10.1073/pnas.0604181103
- Pimm SL, Jenkins CN, Abell R, Brooks TM, Gittleman JL, Joppa LN, Raven PH, Roberts CM, Sexton JO. 2014. The biodiversity of species and their rates of extinction, distribution, and protection. Science 344(6187):987.
- Cowie RH, Bouchet P, Fontaine B. 2022. The Sixth Mass Extinction: fact, fiction or speculation? Biol. Rev. 97: 640-663.
- Hoffman M, Hilton-Taylor C, Angulo A, Böhm M, Brooks TM, Butchart SHM, Carpenter KE, Chanson J, Collen B, Cox NA, et al. 2010. The Impact of Conservation on the Status of the World’s Vertebrates. Science 330(6010):1503-1509.
- IUCN [International Union for Conservation of Nature]. 2023. IUCN Red List version 2023-1: Table 1a. https://www.iucnredlist.org/resources/summary-statistics#Summary%20Tables
- Butchart SHM, Stattersfield AJ, Collar NJ. 2006. How many bird extinctions have we prevented? Oryx 40(3):266-278.
- Mieri S, Bauer AM, Allison A, Castro-Herrera F, Chirio L, Colli G, Das I, Doan TM, Glaw F, Grismer LL, et al. 2018. Extinct, obscure or imaginary: The lizard species with the smallest ranges. Divers. Distrib. 24:262-273.
- Boehm MMA and Cronk QCB. 2021. Dark extinction: the problem of unknown historical extinctions. Biol. Lett. 17(3): 20210007.
- Mora C, Tittensor DP, Adl S, Simpson AGB, Worm B. 2011. How Many Species Are There on Earth and in the Ocean? PLOS Bio 9(8):e1001127.
- Bergström A, Stringer C, Hajdinjak M, Scerri EML, Skoglund P. 2021. Origins of modern human ancestry. Nature 590: 229-237.
- Brenchley PJ, Marshall JD, Carden GAF, Robertson DBR, Long DGF, et al. 1994. Bathymetric and isotopic evidence for a short-lived Late Ordovician glaciation in a greenhouse period. Geology 22: 295-298.
- Sheehan PM. 2001. The Late Ordovician Mass Extinction. Annu. Rev. Earth Planet Sci. 29: 331-364.
- Murphy AE, Sageman BB, Hollander DJ. 2000. Eutrophication by decoupling of the marine biogeochemical cycles of C, N, and P: a mechanism for the late Devonian mass extinction. Geology 28:427-430.
- Wu Y, Chu D, Tong J, Song H, Dal Corso J, Wignall PB, Song H, Du Y, Cui Y. 2021. Six-fold increase of atmospheric pCO2 during the Permian-Triassic mass extinction. Nat. Commun. 12(2137).
- Knoll AH, Bambach RK, Payne JL, Pruss S, Fischer WW. 2007. Paleophysiology and end-Permian mass extinction. Earth Planet Sci. Lett. 256:295-313.
- Tanner LH, Lucas SG, Chapman MG. 2004. Assessing the record and causes of Late Triassic extinctions. Earth-Sci. Rev. 65(1-2):103-139.
- Hesselbo SP, McRoberts C, Pálfy J. 2007. Triassic – Jurassic boundary events: Problems, progress, possibilities. Palaeogeogr. Palaeoclimatol. Palaeoecol. 244: 1-10.
- Chiarenza AA, Farnsworth A, Mannion PD, Lunt DJ, Valdes PJ, Morgan JV, Allison PA. 2020. Asteroid impact, not volcanism, caused the end-Cretaceous dinosaur extinction. PNAS 117(29):17084-17093.